| Administrator Handbook | Table of contents |
|
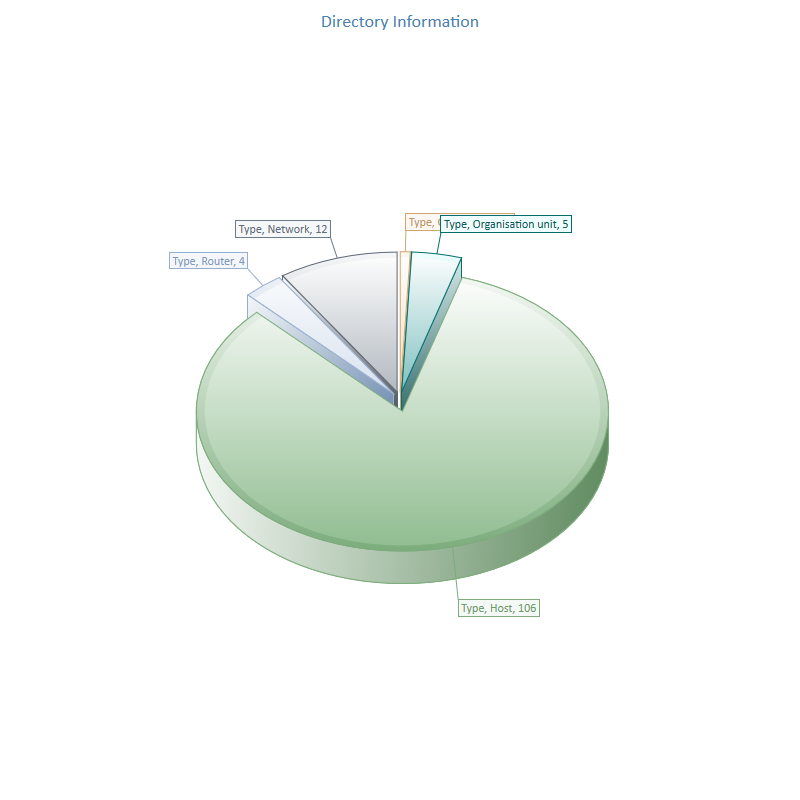
Display a pie chart showing the breakdown by type of object in the LoriotPro directory.
Object type can be: Country, Organisation, Organsation Unit, Network, Host, Router, Task Plugin
The statistical data charts of LoriotPro visually display the summary information on the operating state and sizing of your network and systems. The charts can be displayed on demand or automatically with a Playlist reader (Dashboard Playlist) and allowing the network administrator to monitor at a glance and in real time the overall state of its infrastructure.
In the Dashboard Playlist interface select : 0201 Directory Objects Distribution
The chart can be seen from the WEB interface on the following link: hlua/LP_PIE_DirectoryInfos.hlua
|