| Administrator Handbook | Table of contents |
|
Display a pie chart representing the 10 hosts that have generated the most of SNMP Traps.
The statistical data charts of LoriotPro visually display the summary information on the operating state and sizing of your network and systems. The charts can be displayed on demand or automatically with a Playlist reader (Dashboard Playlist) and allowing the network administrator to monitor at a glance and in real time the overall state of its infrastructure.
In the Dashboard Playlist interface select : 0104 Top 10 hosts for SNMP Trap received
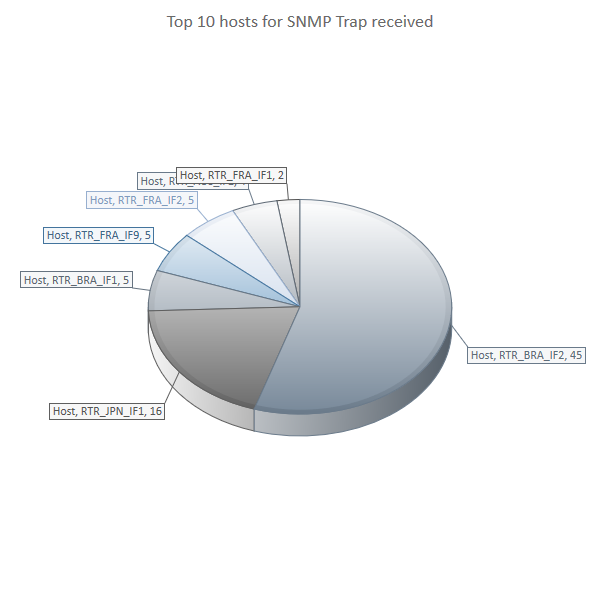
The chart can be seen from the WEB interface on the following link: hlua/LP_PIE_Top10HostTrapReceived.hlua
|