| Administrator Handbook | Table of contents |
|
Display a pie chart of the Servers that are polled with SNMP or Ping and which are not responding from more than 5 minutes.
The statistical data charts of LoriotPro visually display the summary information on the operating state and sizing of your network and systems. The charts can be displayed on demand or automatically with a Playlist reader (Dashboard Playlist) and allowing the network administrator to monitor at a glance and in real time the overall state of its infrastructure.
In the Dashboard Playlist interface select :0010 Monitored Servers not responding for more than 5 minutes
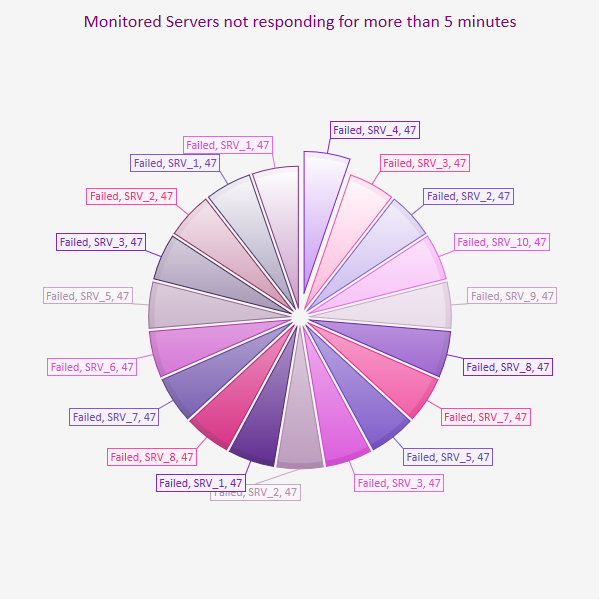
In the labels of the data, Server name and the time in minutes since the loss of connectivity are displayed.
The connectivity status is the last result of a PING or a SNMP collection, performed at regular interval on a device by the Polling process of LoriotPro. The status of all the devices declared in the LoriotPro directory are read and summarized to create the pie chart.
Five statuses are defined to display the level of connectivity.
The chart can be seen from the WEB interface on the following link: /hlua/LP_PIE_ServerOOO5Minutes.hlua
|