| Administrator Handbook | Table of contents |
|
This documentation page of the LoriotPro Software concerns the WEB interface of the product.
In addition to its graphical interface in Windows™, the LoriotPro software integrates an HTTP server and thus offers a multi-user GUI in a WEB interface. The data collected by the software in SNMP or by other means are accessible via this interface. Numerous charts, histograms, tables, assist you and give you information of states and of performance on the infrastructure monitored.
Reminder: An internal process to LoriotPro provides scheduled interrogation at regular intervals of all the hosts of the directory (Directory) is the polling process. Thanks to the process of polling LoriotPro displays real-time availability status of devices connected to the network by changing their color status in the directory, network topology maps (Internetwork Map) and the Health Control Center. The Polling Process performs queries in SNMP V1, SNMP V3 V2c (restricted) and / or ICMP (Ping IP) hosts using their configuration properties stored in the directory. The Polling Process generates alarms and events(LoriotPro events) when hosts change of status and manages color changes icons wherever necessary in the graphical interface of LoriotPro.
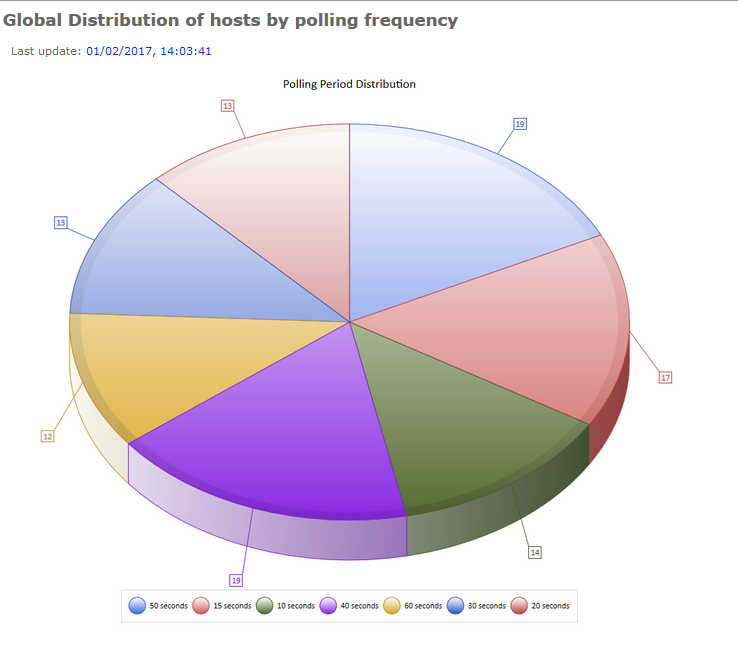
The pie chart of the distribution of hosts classified in second polling interval is accessible via the main menu option Global Inventory (resources).
Then the menu item: Distribution of hosts by polling frequency
|