| Administrator Handbook | Table of contents |
|
This documentation page of the LoriotPro Software concerns the WEB interface of the product.
In addition to its graphical interface in Windows™, the LoriotPro software integrates an HTTP server and thus offers a multi-user GUI in a WEB interface. The data collected by the software in SNMP or by other means are accessible via this interface. Numerous charts, histograms, tables, assist you and give you information of states and of performance on the infrastructure monitored
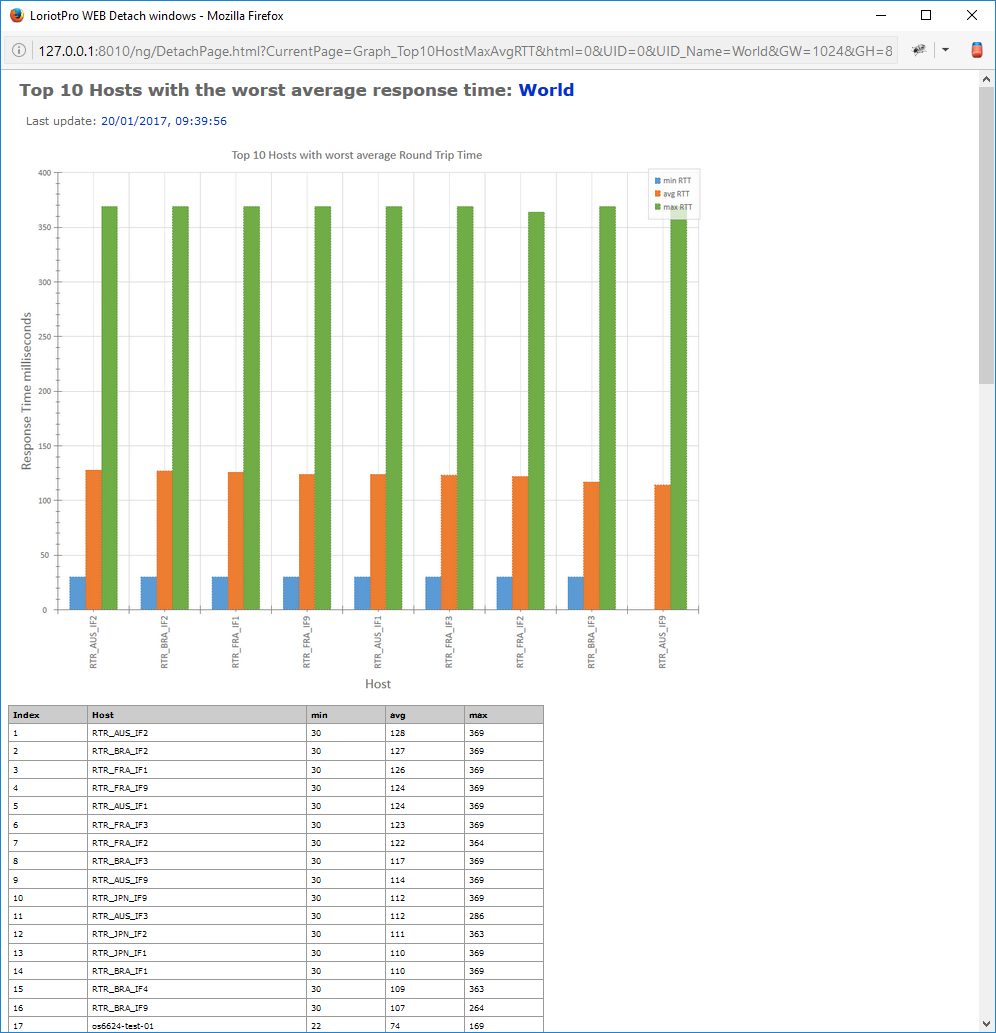
This menu option displays Histogram of the 10 hosts with the worst Ping IP and SNMP response times.
An internal process to LoriotPro provides scheduled interrogation at regular intervals of all the hosts of the directory (Directory) is the Polling Process.
The response time of each query of the query process is stored. By default, the last 100 queries are stored for each host in the directory.
The histogram below is created to display on the selected container the Host with the worst average response time. This allows you to identify host or network areas with performance problems.
The chart displays for each host its minimum , maximum and average response time (RTT)over the last 100 queries. The RTT is the Round Trip Time or the time required by the Ping IP or SNMP request to perform a round trip to the queried device.
|