| Administrator Handbook | Table of contents |
|
The Linear Graph displays two SNMP object values (Y axis) on a time period (X axis).
This Directory Plugin performs graphics with the results of predefined SNMP requests. The requests are sent to� the host to which the Plugin is linked.
LoriotPro also explicitly uses this Plugin in some of its menus or in the MIB tree window.
Plugin LoriotGraphCounter2.slp
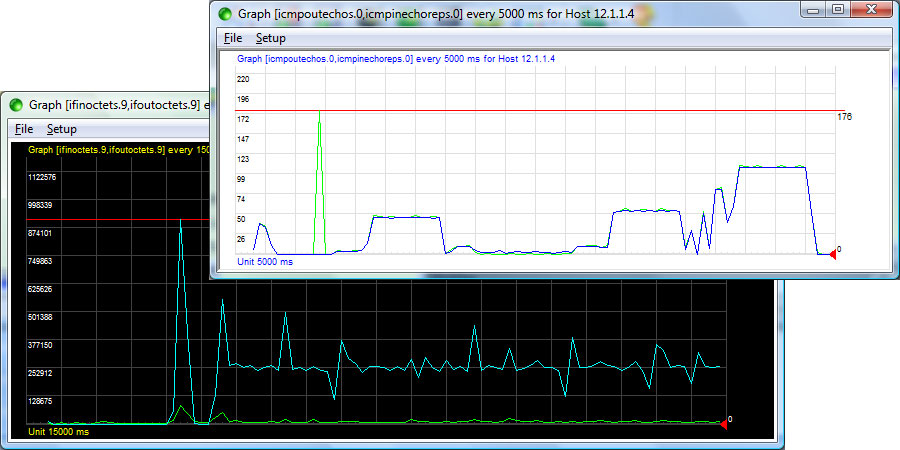
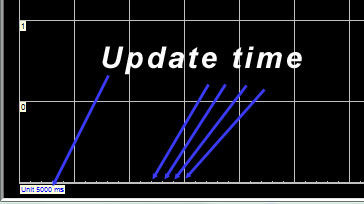
The upper graph (with a black background) displays the load (in and out) on a network interface. The scale of the abscissa is in bytes, the scale of the ordinate is in seconds (1,5 seconds between each small marks)
Vertical grid lines are displayed each 5 polling intervals (or unit) . 7, 5 seconds in the upper graph example.
The linear graphic always contains 100 samples. In our exemple the graphic display the load over a period of 25 minutes in total (100 x 15 seconds)
Launching the Linear graph plugin
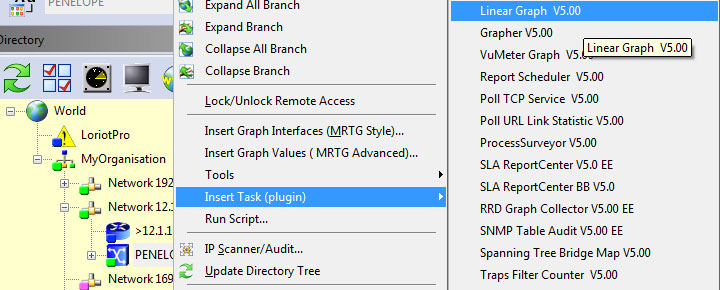
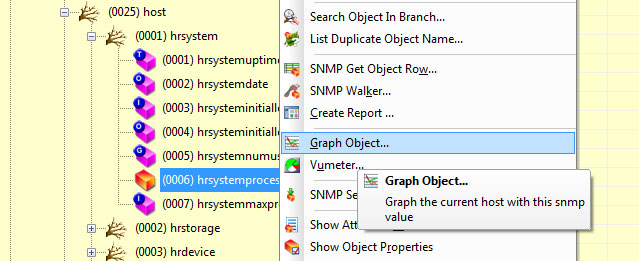
The Linear Graph plugin can be called from the contextual menu of a host (in the directory) or from a MIB object (in the MIB Tree.
Exemple select a host in the directory and click the mouse right button to open the contextual menu.
Choose Insert Task and Linear Graph
Configuration
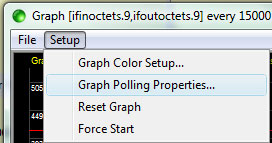
Use the Setup options of the Window to configure this Plugin.
First you need to define which snmp object to graph.
select:
Setup>Graph Polling Properties…
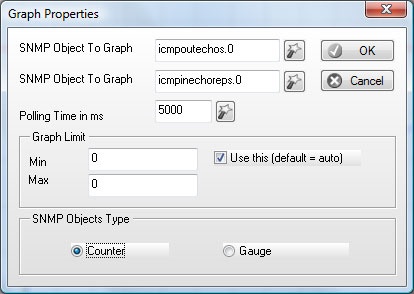
The window allows you to configure the SNMP and display settings.
The Plugin could display two curves on the same graph. In our example, the ifinoctets and ifoutoctets SNMP object has been selected. You should know the index number of the object if necessary (here Network interface have an index).
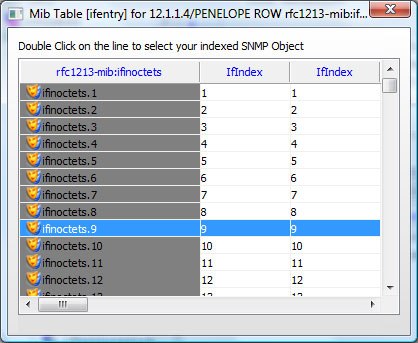
The first and fastest way for selecting the OID is to use the WIZARD by clicking on the + button.
Consult the WIZARD chapter for detail.
In the wizard, if you choose an indexed snmp object, the list of available objects is displayed. Choose one by clicking in a cell of the first column.
See example below on the ifinoctets object.
You should also choose the polling interval. The polling interval defines by default the scale of the ordinate. It also define the time between to marks.
The unit value is displayed in the lower left angle of the graph.
The min and Max values set the Y scale (abcissa) upper value and the Y scale lower value.Check the box for activation your own scale values.
The Counter Check Box is used when the OID is of counter type. In this case the value displayed is the difference between the current value and the preceding value divided by the elapsed time between each measure.
The Gauge check box is use with OID of gauge type. Value of gauge type are directly displayed.
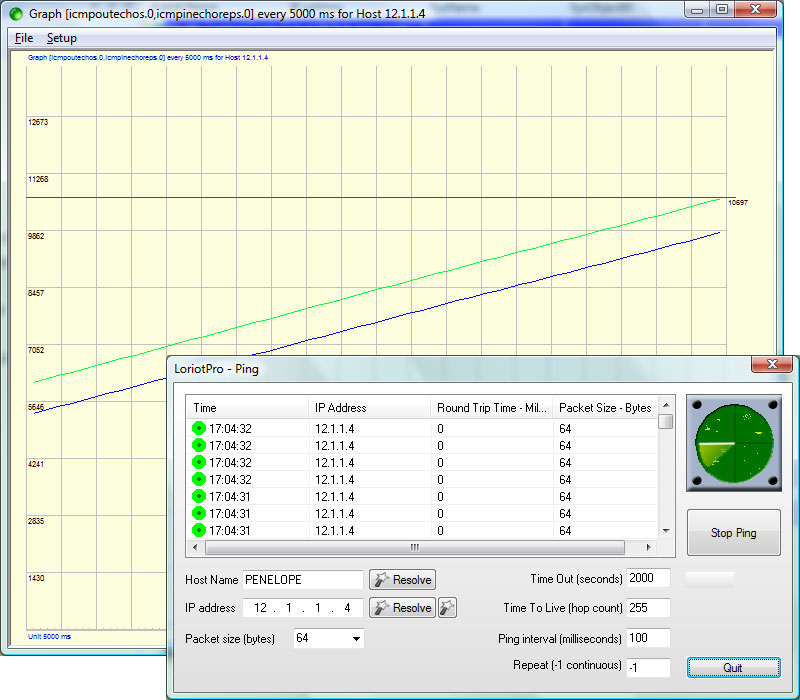
Example of graphics of a gauge object that count the number of ICMPPING send and received by a host. The Loriotpro ping has been used to generate the flow of ping, 10 per seconds
The results displayed on the graphique with the option Counter checked
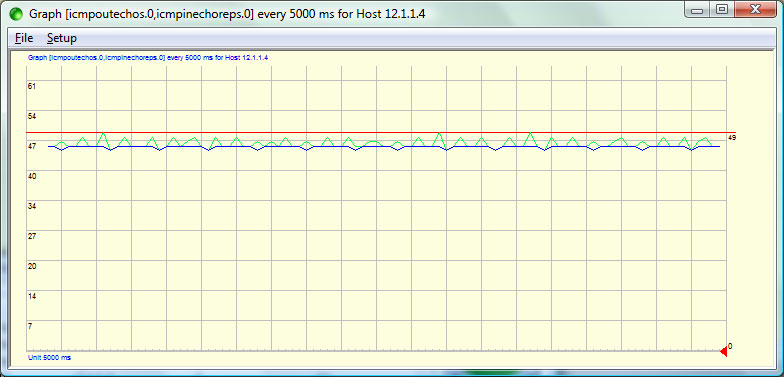
The same but with the option Gauge checked.
From the menu select:
Setup>Graph Color Setup…
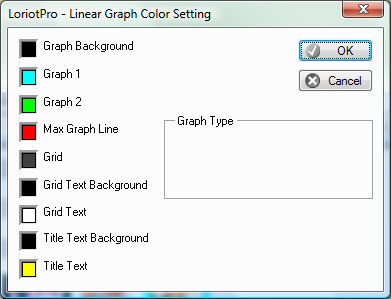
This first screen allows you to setup the various color.
There are additionnal options accessible from the menu.
|