| Administrator Handbook | Table of contents |
|
This directory plugin of LoriotPro is a very powerful solution for monitoring and finding network troubles and network usage trend of a huge number of SNMP objects located in a SNMP Table or in predefined list of SNMP object.
It can be used for auditing any set of separate SNMP objects or a SNMP table. It can be or not related to network devices.
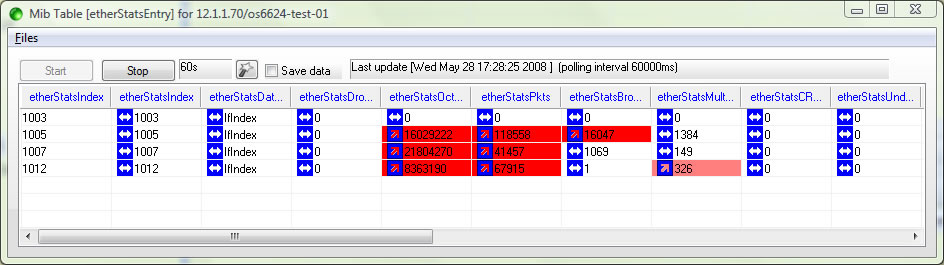
The following example displays the etherstatsentry of the RMON table of an ethernet switch. The etherStatsTable collects a variety of counts for each attached subnetwork, including byte, packet,error and frame size count.
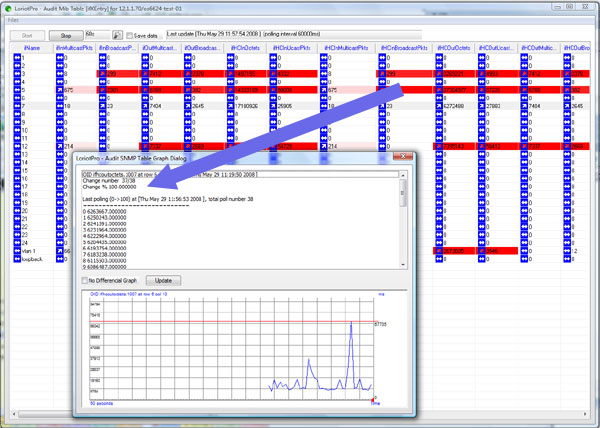
A click on a cell displays the last values and the current graph (example on the ifxentry of the ethernet switch)
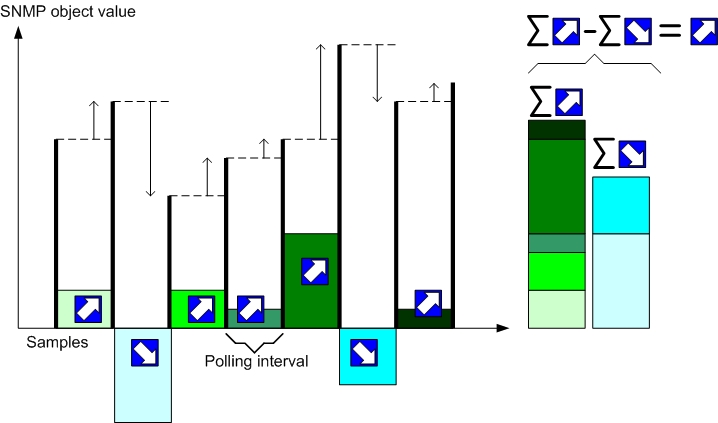
Arrows indicates the global trend of the SNMP value since the start time.
| The value is increasing most of the time. Since the start time the number of changes between to successive samples toward a higher value are greater than the number of change toward a lower value. | |
| The value stays constante | |
| The value is decreasing most of the time. Since the start time the number of changes between to successive samples toward a lower value are greater than the number of change toward a higher value. |
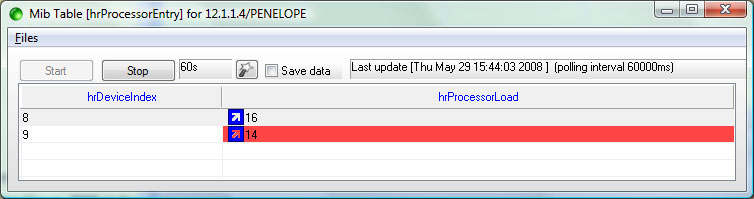
The background color of a table cell indicates the ratio between the total number of samples and the total number of changes. A dark red color indicates that 100 % of the samples collected contains changes and the light red indicates that few changes have occurred.

The installation of a Directory plugin is explained in this chapter
The SNMP values to display can be taken in a SNMP table object or in aSNMP list of object. SNMP list are define as sci file and can be created with the sci script editor. sci files are simple text file that contains snmp objects with their index, one per line.
To open a new audit form a SNMP table select the menu option
Files>Set new audit table
The SNMP table selection Wizard is dispalyed
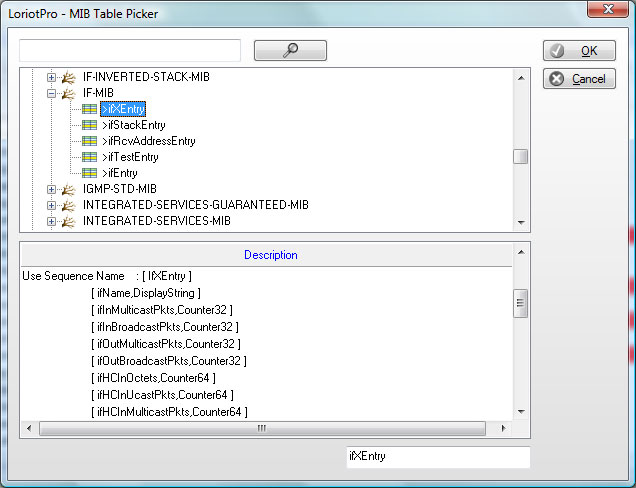
Click on OK when a table is selected.
Click on the start button to start the collection of values.
To use a sci file you should first define the sci. You can simply use a text editor and add you objects.
example of sci file and table audit:
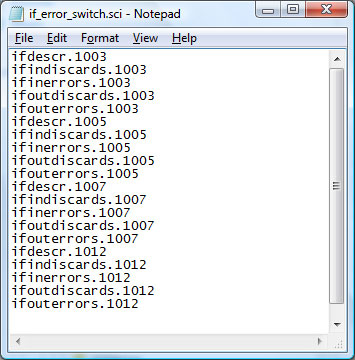
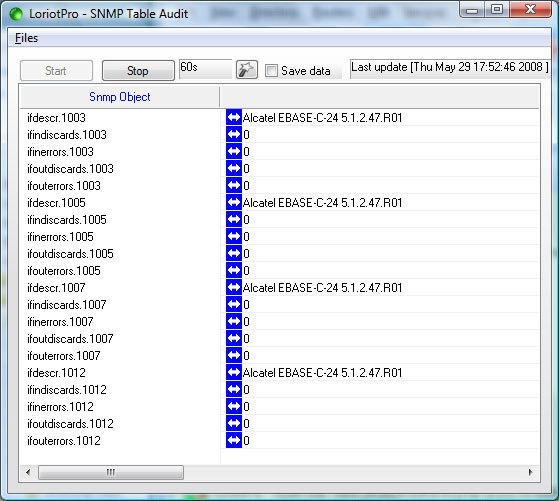
The sci file should containts the selected snmp objects (switch port objects) and their index.
Interpreting results
In the following example we have selected the hrProcessorEntry table that displays the usage of a dual CPU systemin our example.
The hrprocessorLoad SNMP object is a gauge. The value can increase or decrease between 0 to 100.
If we click on the cell the graph below is displayed. By default the graph uses the differential mode. The points of the graph are the delta between the current value and the preceding one.
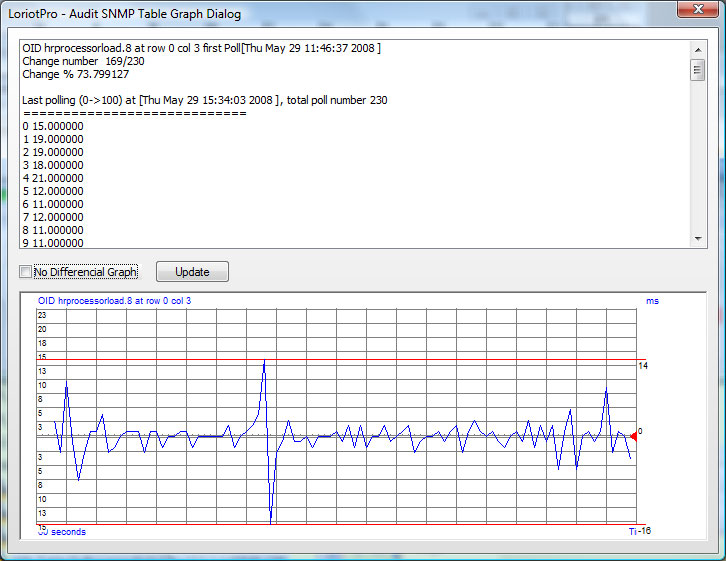
If you check the No differential checkbox the graph will display the value of the CPU usage and no the delta.
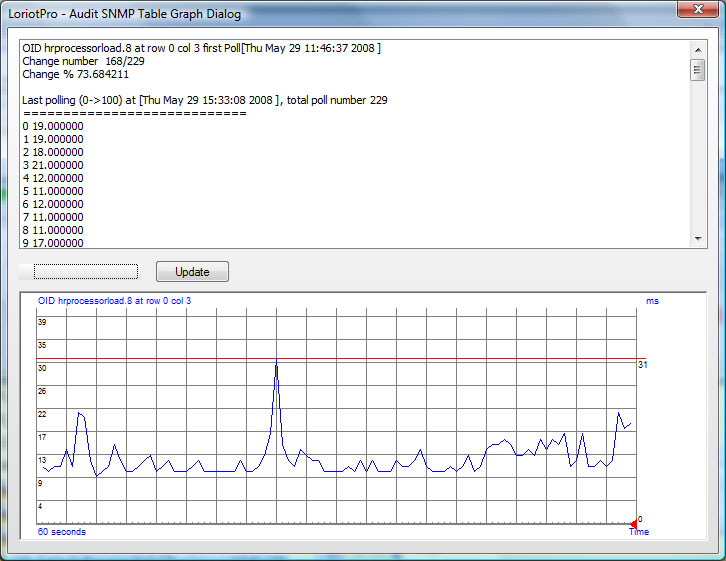
The information in the top pane displays the calculated values.
The Change number value displays the number of changes and the number of samples
The Change % value display the ratio of the change number and is used to define the background color.
|