| Administrator Handbook | Table of contents |
|
The Advanced TCP/Audit Polling plugin monitor the availability and the performance of any networking application (client/server application).
Audits are attached to IP devices declared in the LoriotPro directory as in the example below. They can be dedicated to accurate monitoring on a single system but nothing prevents them from also being used to correlate information from multiple devices.
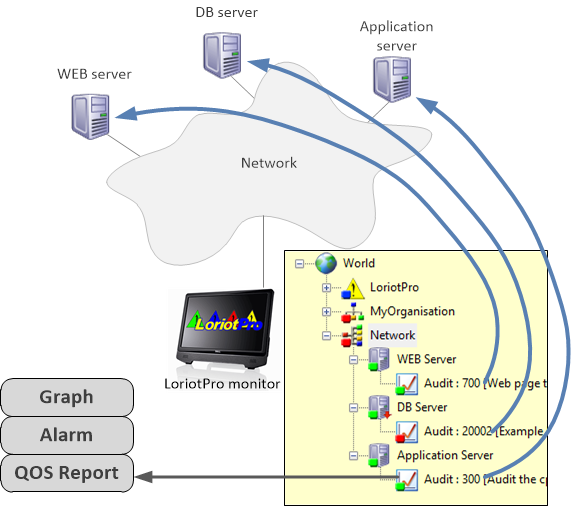
Audits are primarily used to measure two quality of service indicators, the availability and the performance. Availability indicates an operating status while performance consists of a response time and/or a processing time.
With these measures, it is possible to promptly notify an administrator of any quality degradation through alarms. It is also possible to calculate availability and performance rates over a time period and then compare them to baseline values to generate Quality of Service (SLA) reports. The data collected by the Audits can be memorized and then used by the QoS Report Generator.
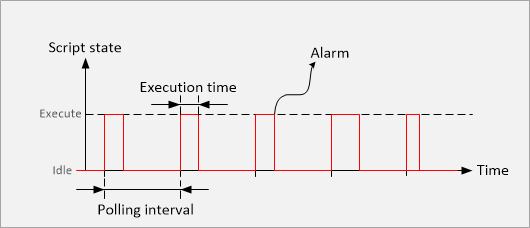
Audits are also programs that run at regular intervals ranging from the second to several hours depending on the scalability and criticality of the indicators to be monitored. For example, the monitoring every 10 minutes of the level of the charge/discharge of an inverter battery can be considered as relevant while the more critical control of the current source (battery or sector) of this same Inverter should be done every minute.
Audits offer two main modes of treatment (Polling Type). TCP connection and LUA script execution.
The TCP connection is simply used to check the presence of a server connected to the network. The server must offer services over TCP, as is the case for example Web servers, FTP, Telnet, SMTP, etc. The test performed by the Audit consists of a connection at the TCP level to the server and then to the release of this one. The success or otherwise of this connection allows to deduce a status of availability while the connection time is used as a performance indicator.
The second mode is based on the use of script in LUA language. A library of scripts allows administrators to activate in a few mouse clicks the establishment of a variety of monitoring without making any coding. These include just a few, monitoring router routing tables, server web pages, printer consumables, server disks, SQL tables, Nagios plugins etc. For developers, this library is easily extensible from your own scripts. They can handle any type of need thanks to the wealth of advanced collection and processing features available with LoriotPro. In addition, the LUA script editor integrated with LoriotPro makes it possible to quickly create new scripts in the expected Audit format.
One of the great strengths of Audits is their multitasking implementation within the LoriotPro solution. Audit Plugins are programs running at regular intervals in threads and are inherently close to real time. A Threads pool is assigned to them by default to guarantee their execution in time constraints. Thousands of collections and treatments are therefore possible in a few seconds.
Administrators can set up and configure Audits in a few minutes using the LoriotPro graphical interface. For larger configurations, the creation and configuration of Audits can be fully automated through dedicated functions and the built-in LUA scripting language. The LoriotPro Autodiscover module is also able to attach Audits to devices based on their model. This capability opens up the possibility for more complex auto configurations by removing long and tedious installation steps.
Audits are used in the LoriotPro Broadcast Edition for executing Scripts attached to Global Objects belonging to the same group. LoriotPro offers in this edition the support of an internal database of objects each having a method based on an LUA script. The Audits and Global Object combination provides exceptional control over real-time multitasking. You can view this use of Audits on this link.
The monitoring is performed by establishing simple TCP connections to the servers or by establishing a more complex dialogue.
These dialogues are based on dedicated script programs (Using LUA script language).
The completion status of the request(s) and the response time are used to warn the administrator of defaults and to establish quality of service reports.
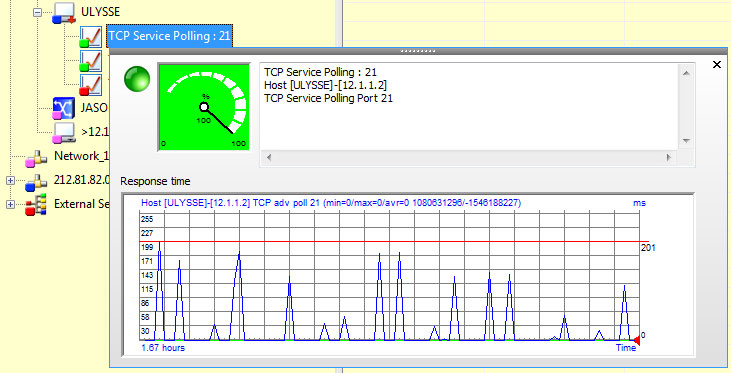
The plugin display the current polling status and can display (with a single click on the graph icon) the response time value of the last 100 requests.
Installing the plugin
There are two ways to attach a Plugin to a host in the directory.
Method 1 - In the directory, select the host on which you want to add the audit plugin.
Then select from the context menu the option Properties or the icon ![]()
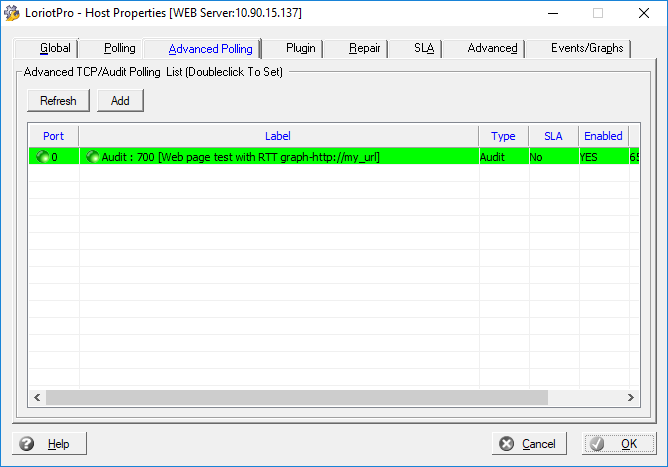
In the Properties select the Advanced Polling tab then the Add button
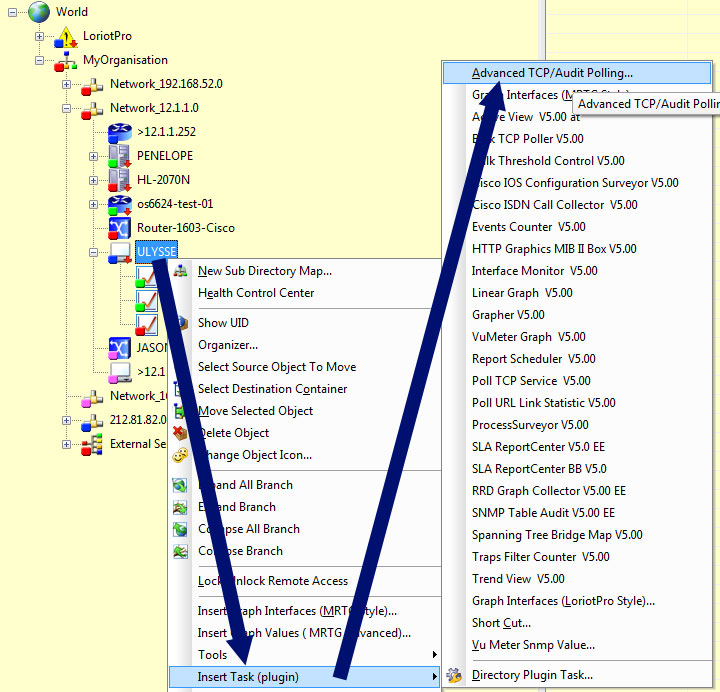
Method 2 - Select a host in the LoriotPro directory and call its contextual menu with a right mouse click.
Select the Task option first then the Advanced TCP/Audit Polling option of the second menu.
An alternate way consits of using the host property and the Advanced Polling tab.
Configuring the plugin "Advanced TCP Audit polling"
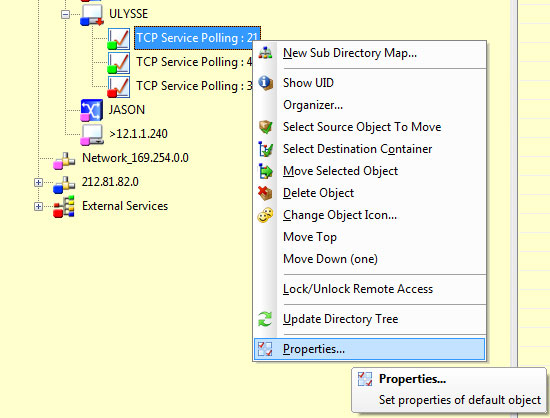
To configure the plugin use the contextual menu and select the Properties option.
Or click on the properties icon![]()
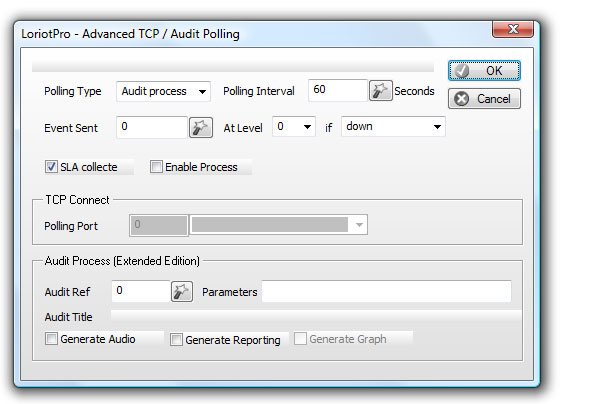
The configuration dialog box is displayed
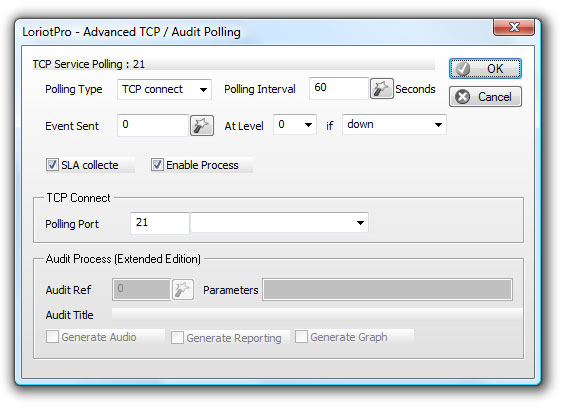
The minimum configuration steps are:
Common application TCP ports are available in the configuration dialog box. In the following list you will find the most frequently used.
Application |
Protocol |
Listenning TCP Port |
File Server |
FTP (File Transfert Protocol) |
21 |
TFTP Trivial File Transfer |
69 |
|
Microsoft Server |
MS-RPC (appels de procédure distants (RPC). |
135 |
Netbios-ns NETBIOS Name Service |
137 |
|
netbios-dgm - NETBIOS Datagram Service |
138 |
|
netbios-ssn - NETBIOS Session Service |
139 |
|
WEB Server |
HTTP (Hyper Text Transfert protocol) |
80 |
|
HHTPS – HTTP sécurisé |
443 |
Messaging Server |
SMTP (Simple Mail Transfert Protocol) |
25 |
SMTP/SSL |
465 |
|
POP3 – (Post Office Protocol – Version 3) |
110 |
|
POP3/SSL (Secure Sockets Layer) |
995 |
|
IMAP4 ((Internet Message Access Protocol) |
143 |
|
IMAP4/SSL (Secure Sockets Layer) |
993 |
|
Lotus Notes |
1352 |
|
X.400 |
102 |
|
Database Server |
MS SQL (Microsoft SQL Server) |
1433 |
My SQL Server |
3306 |
|
Serveur Oracle |
1521 |
|
|
Postgres SQL |
5432 |
Name Resolution server |
DNS – Domain Name Service |
53 |
Address resolution server |
BootP (Bootstrap Protocol Server) |
67 |
Directory server |
LDAP Lightweight Directory Access Protocol), |
389 |
LDAP/SSL - (Secure Sockets Layer) |
636 |
|
Microsoft-ds (Directory Services) |
445 |
|
VIDEO server |
H.323 (Vidéo) (ITU-T H.323 définit la conférence multimédia) |
1720 |
Audio server |
conférence audio |
1731 |
Monitoring server |
Agent - SNMP Simple Network Management Protocol |
161 |
Some options are available at this configuration step.
The SLA Collect check box enables the gathering of data for the calculation of the quality of service level. Responses to the requests sent by the TCP polling process will be stored in history files. The history files can be used later on to create QOS reports with the SLA Report Center plugin or with the SLA scripting functions
Sending of an alarm (Loriotpro Event) on successful or unsuccessful connection.
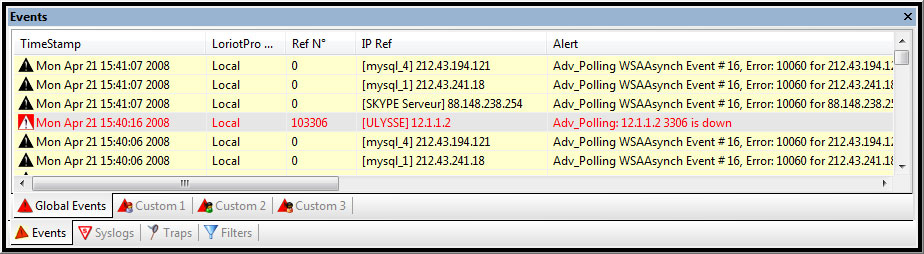
here under an example of setting on a :
With an alarm set (Event 103306)
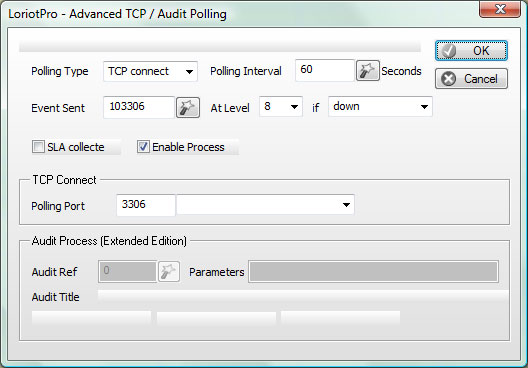
The event is generated at each polling without answer.
Monitoring and auditing with scritping
The owners of a LoriotPro Extended Edition can monitor and audit any application or system with the Audit Process feature.
The Audit Process of LoriotPro can launch audit and monitoring programs that can perform any kind of availability or performance checking.
These programs are written with the LUA script language embedded in LoriotPro. Audit and monitoring programs are available and you can extend the list with your own program.
A programmer’s manual is dedicated to the scripting language and the way of writing your own monitoring program.
To add a new monitoring program the polling type selected should be Audit Process. The fields of the Audit Process area in the dialog box will be automatically activated.
The minimum configuration steps are:
Click on the Wizard button ![]() to open the script selector or enter the program number if you already know it.
to open the script selector or enter the program number if you already know it.
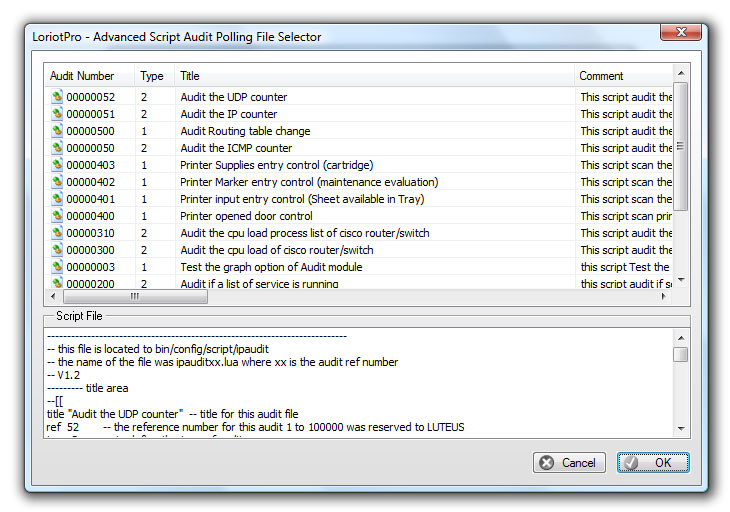
The selected script number is displayed in the Audit Ref Field
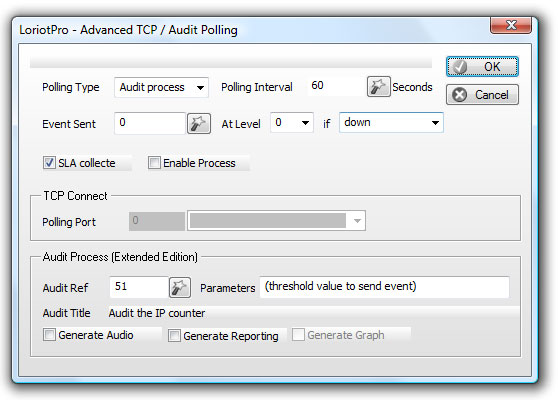
The Parameters field displays a text explaining what value is expected from the script, in this example the threshold value used fro triggering an event.
Audit Title displays the description of the script.
You can add options with:
Generate Audio
Generate Reporting
Generate Graph
|