![]()
![]()
Administrator
Handbook
www.loriotpro.com
|
Administrator
Handbook |
TOC |
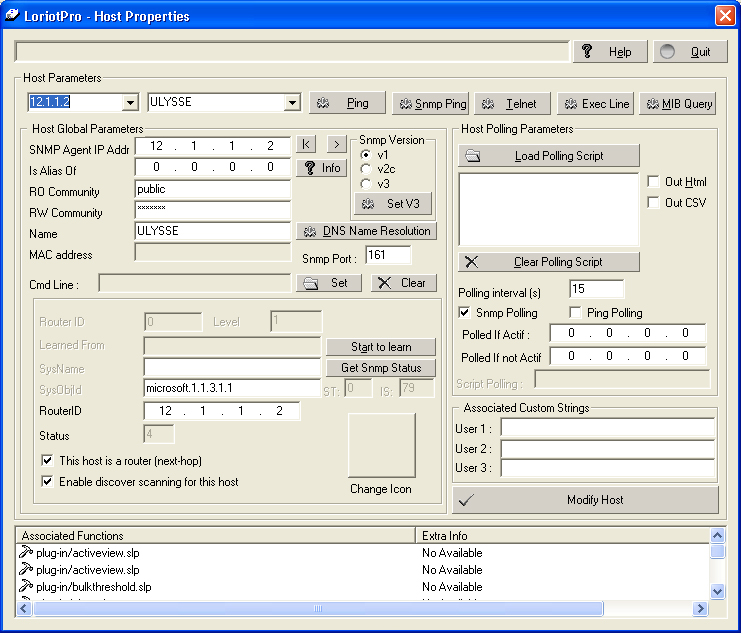
The Event window
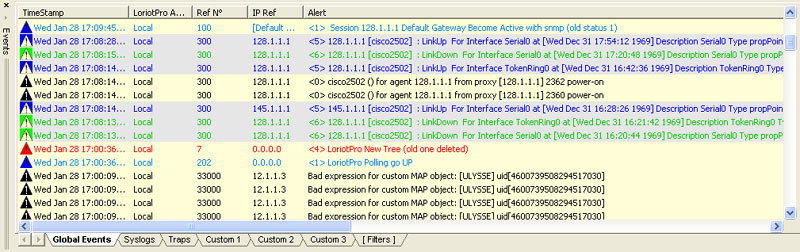
The event window contains a set of windows allowing you to filter and visualize received information, notifications and alarms.
Global Event windowThis window displays all filtered messages. Messages are of different types and a full chapter in this manual describes how to use them efficiently for a proactive supervision of your information system.
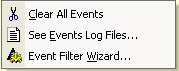
Global Events associated functionsEach window has its own context menu.
The messages received by the event process are stored in files on a daily basis or in an ODBC standard database. These files are easy to access from the menu.
To see them, from the main menu select:
Supervise>See Events Log Files…
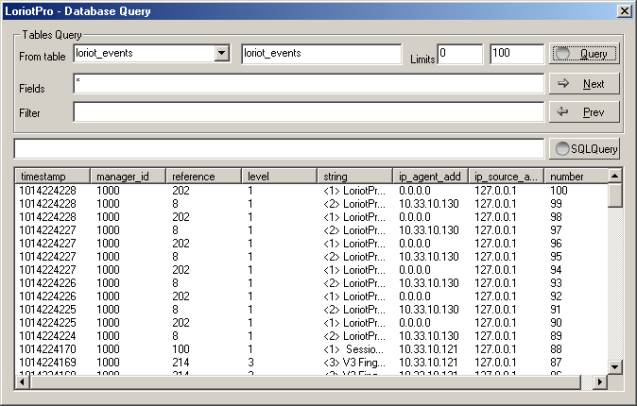
If you have configured the database access, it is possible to read stored events from the database by using the æTables Queries æ window.
Remark: To use this functionality, read the chapter about database configuration and exploitation.
To access your records from your database select from the main menu:
Supervise>DatabaseĀ Query…
Ā 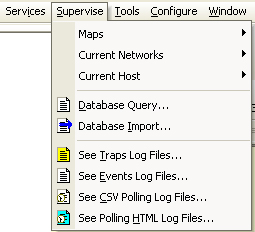
Global Event, ODBC Tables, Queries
The Global Events window icons are made of triangles containing a question mark and are of different colors.
Table of Global Events window status icons
| Icons |
Functions |
Remark |
| |
Message of level 0 |
low severity |
| |
Message of level 1 |
|
| |
Message of level 2 |
|
| |
Message of level 3 |
|
| |
Message of level 4 |
|
| |
Message of level 5 |
|
| |
Message of level 6 |
|
| Message of level 7 | ||
| Message of level 8 | very high severity | |
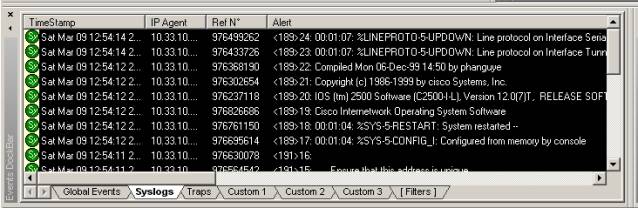
When a message is sent to the LoriotPro alarm server process with a Syslog structure type, it is automatically displayed in the Syslog window.
. The icon ![]() ĀĀis used to represent this type of event.
ĀĀis used to represent this type of event.
![]() Attention
Attention
LoriotPro is not designed as a professional Syslog server; however, it does
allow you to receive them and should fit your needs as long as the number of
Syslog messages that you receive stays low.
To activate the Syslog server on port UDP 514, refers\ to the Event Management chapter.Ā
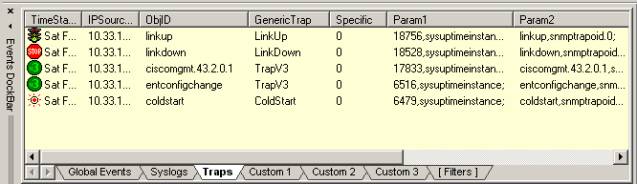
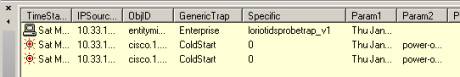
LoriotPro supports the receipt of SNMP traps of type V1 V2C and V3 HMAC-MD5, each of them is displayed when received in the trap window.
Trap window associated FunctionsDouble-clicking on a line of the trap window displays the host properties window of the sending host if it is registered in the Directory.Ā
Trap status iconsThe software uses different icon presentations according to the received Trap type.
Table of icon type
| Icons |
Functions |
Remarks |
| |
Coldstart |
Sent by a device that has been powered on |
| |
Start |
Sent by a device that has been put in soft reset |
| |
Linkdown |
The physical connection of a link is broken |
| |
Linkup |
The physical connection of a link is up |
| |
Authentication error |
The SNMP authentication between the agent and the management serverĀ has failed |
| |
EGP |
|
| |
enterprise |
An enterprise Trap has a proprietary value specified in the Specific column. |
| |
||
| |
Notification v2c |
This trap may indicate a severe problem |
| |
Inform V2c |
This trap is informational and not severe |
| |
Notification v3 |
This trap may indicate a severe problem |
| |
Inform V3 |
This trap is informational and not severe |
Remarks: Consult the Event Management chapter for more details.
Introduction
The Custom 1 to Custom 3 windows are used to display filtered events. The filter rules are defined in the trapfilter.txt file located in the bin directory of LoriotPro.
Remarks: Consult the Event Management chapter for more details.
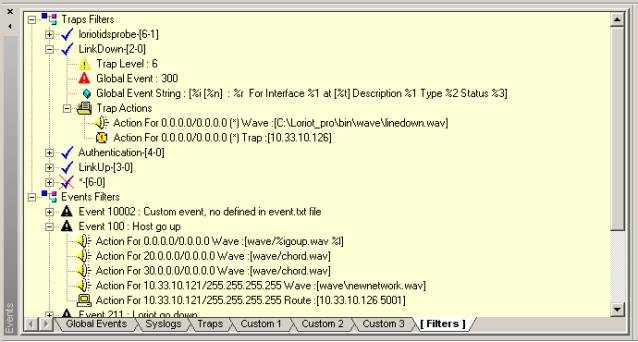
The filters window displays in a graphical way the filter defined in the trapfilter.txt file.
Filters can be set up by using a context menu.
Remark: Consult the Event Management chapter for more details.
|